§ Operator SurfaceDocument · REG-OPS-2026.06

AI does the work. People own the decisions. This is where they meet.

A queue that routes the right task to the right person, review screens with the evidence attached, and a case record that always answers “what’s it waiting on?” The human-in-the-loop the safety page promises — as an actual product surface.

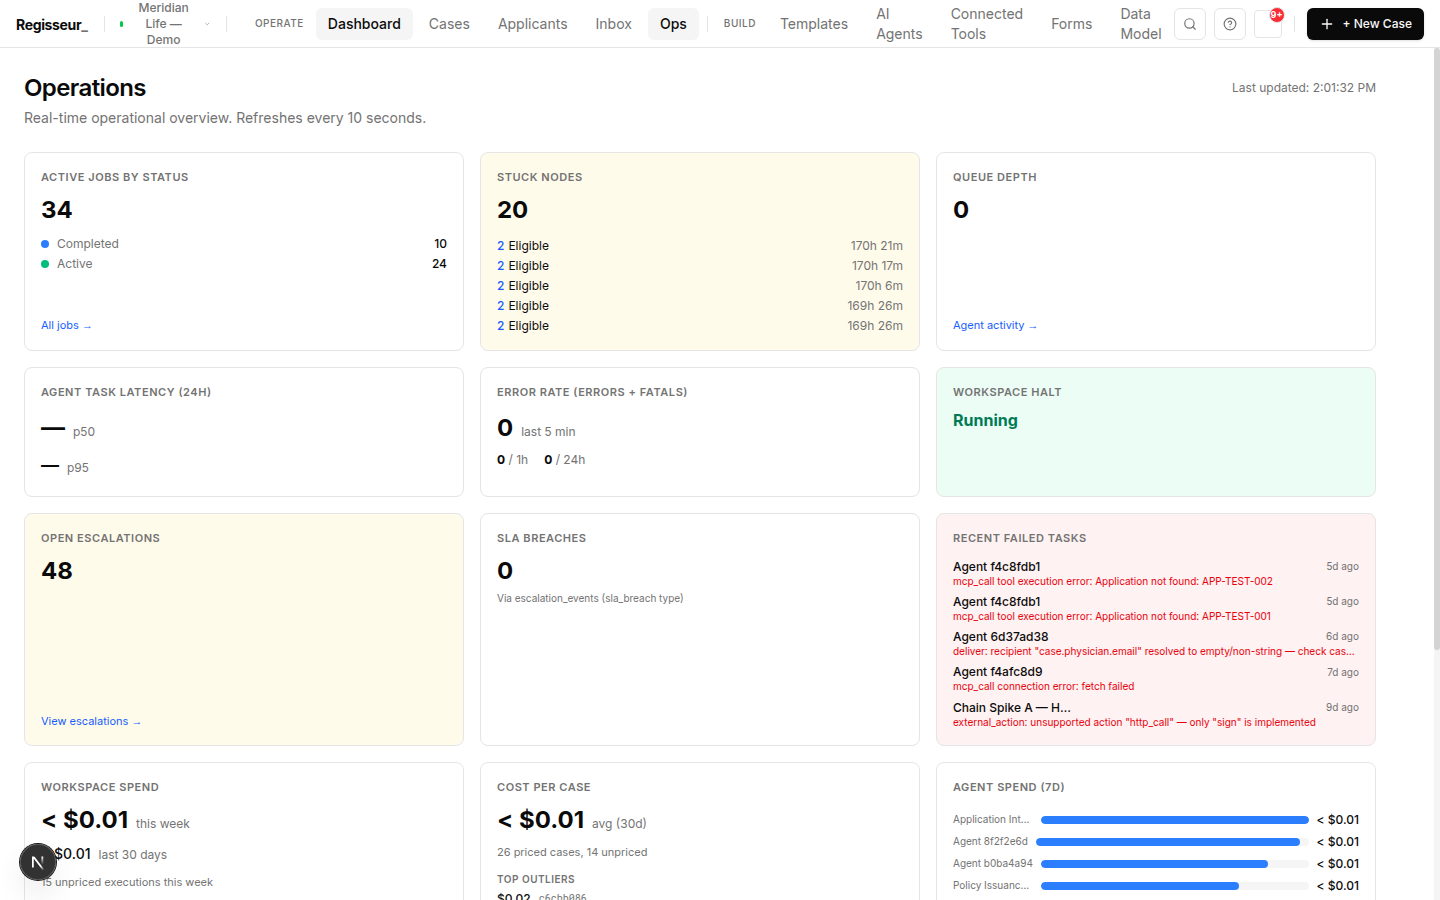
The operations dashboard — active jobs, stuck nodes, open escalations, SLA breaches, workspace halt status, and spend per case, all from real case data.
The operations dashboardActive jobs, stuck nodes, escalations, SLA breaches, spend — real data
§ 01The Inbox

The Inbox.

Everyone's work queue. Acting on a task is the trigger — the moment you complete or approve, the cascade advances the case automatically. No separate "continue" step.

My Work
Assigned to you
Needs Review
Decision gates
Overdue
Past the time budget
All
The workspace
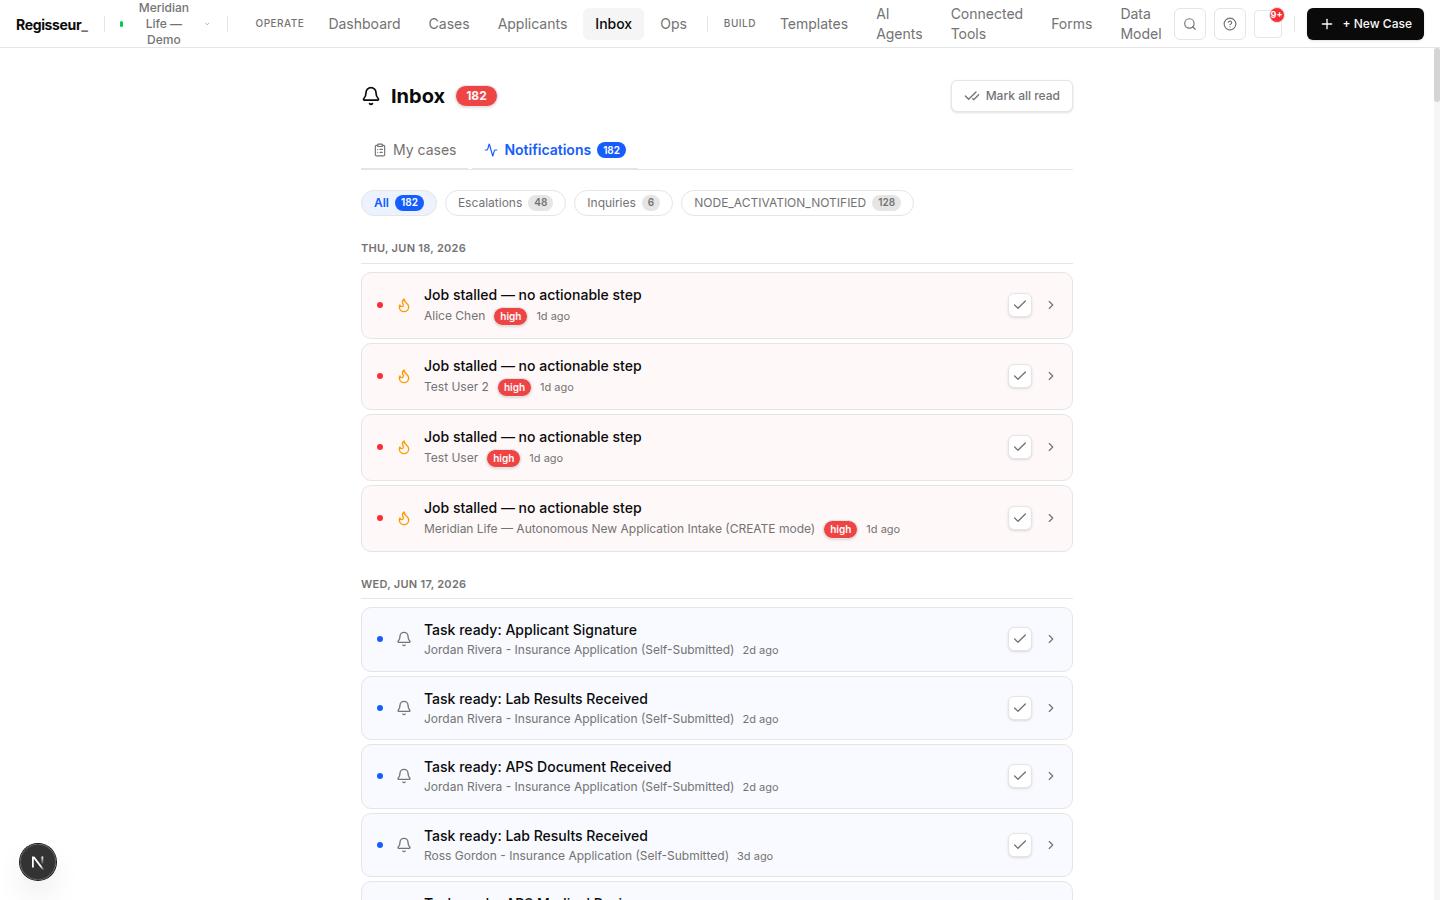
The Inbox — a categorized feed of escalations, inquiries, and node activations, with task-ready items and coordinator job-stalled escalations.
The InboxEscalations, inquiries, and node activations in one feed
§ 02Reviews

Reviews and approvals.

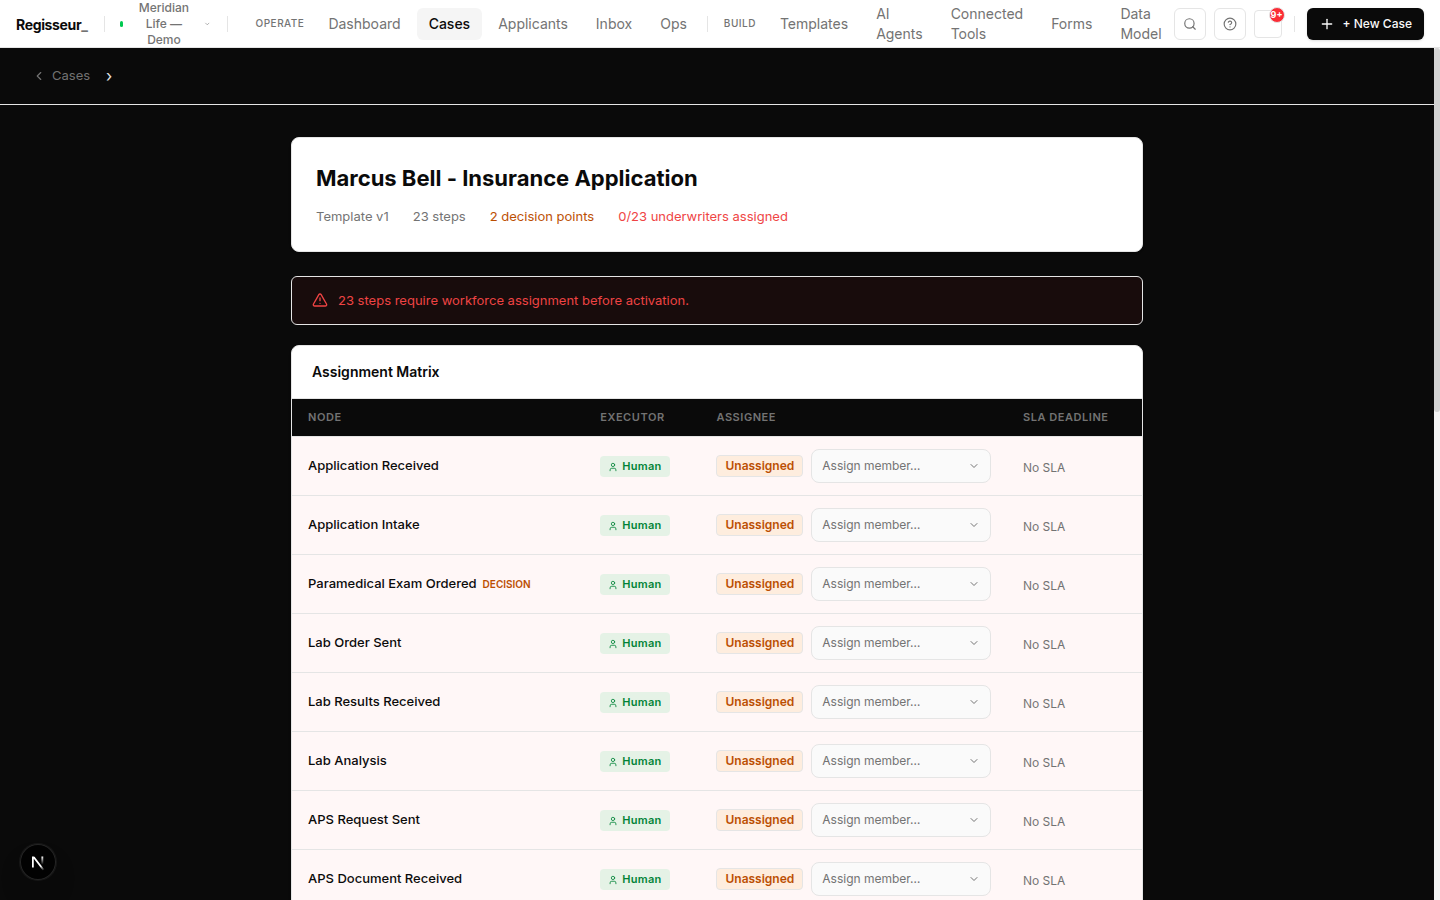
A review screen shows what you're deciding and the context to decide well: the approve/reject action, the assignment matrix (who's eligible and why), the SLA (due / overdue), non-blocking warnings (advisories that inform but don't block), and the artifacts the step produced.

Approve and the case advances; reject and it follows the workflow's rejection branch — not a dead end.

An activation review screen with an assignment matrix of node, executor, assignee, and SLA, plus non-blocking warnings.
A review screenAssignment matrix, SLAs, and non-blocking warnings
§ 03The case record

The case record.

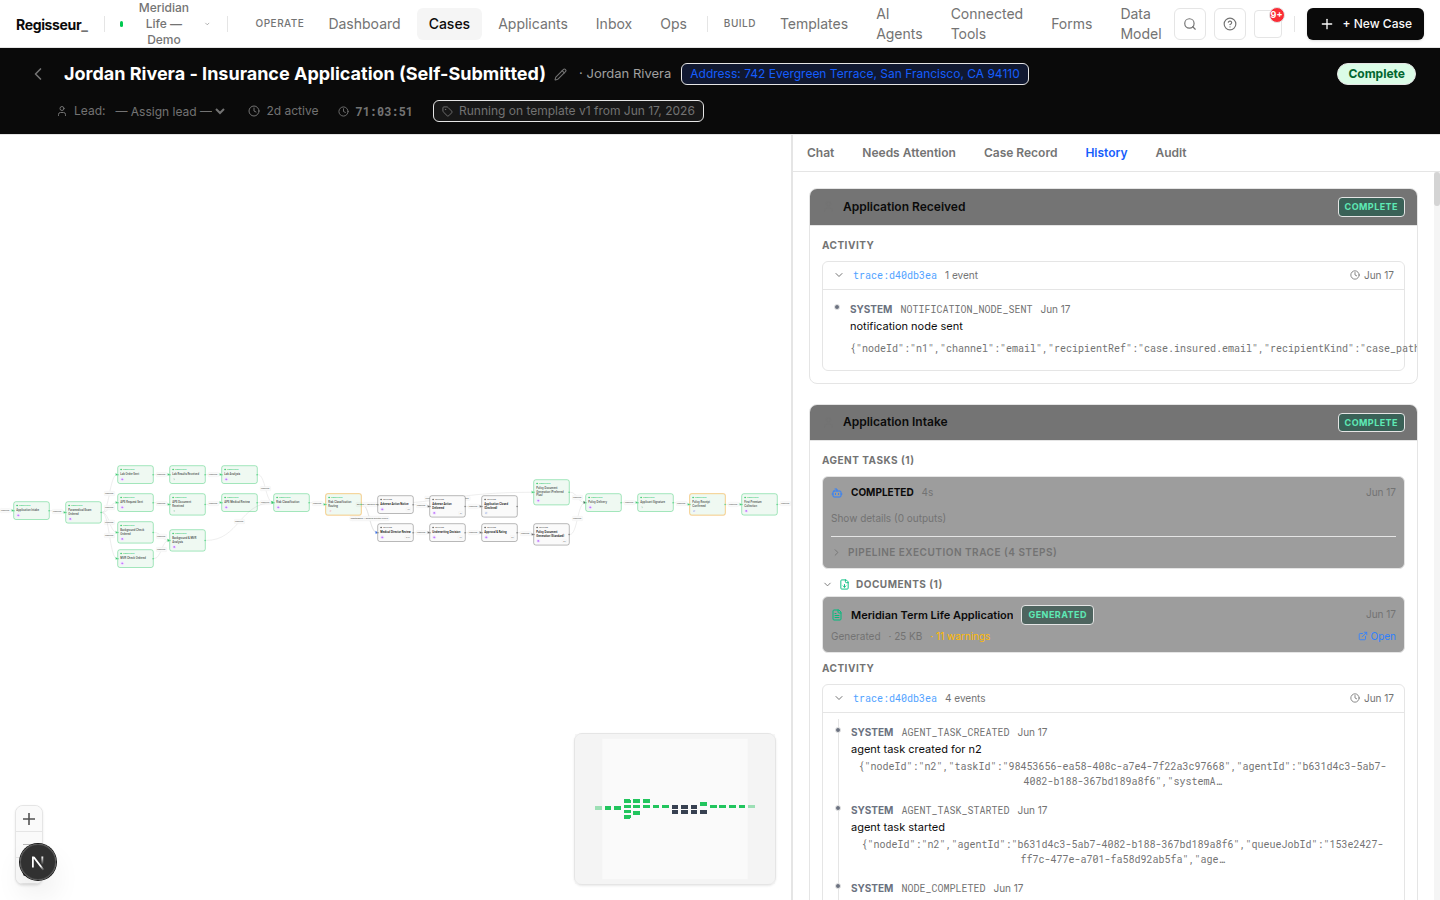
Open any case for its full record: Case Record (structured data), History (the timeline of every node, actor, and time — where you diagnose a stall), Artifacts (documents produced or collected), and Related Cases (the chain when one process triggers the next).

Case history — per-node activity, agent tasks, a generated document, and event-level trace IDs.
Case historyEvery node, actor, artifact, and trace ID
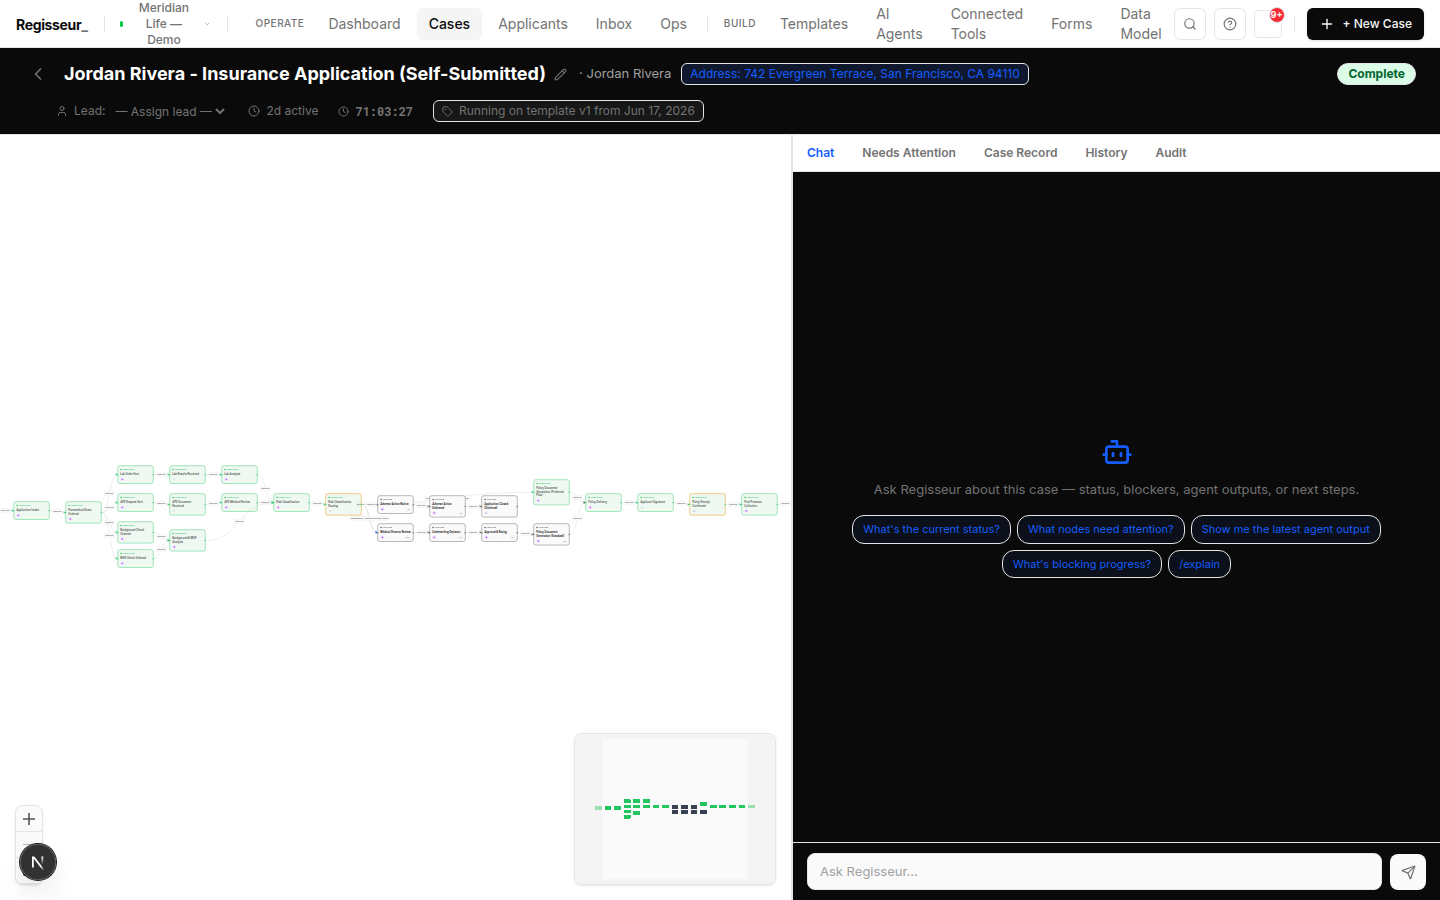
The executed case graph — completed and skipped nodes with condition routing, alongside the AI case-assistant panel.
The executed graphCompleted and skipped nodes, with the case assistant
§ 04Dashboard

The operations dashboard.

The workspace-wide view: throughput, cycle time (median / p90), automation rate, and SLA-breach / at-risk counts, trended over time. Every figure comes from real case data — nothing fabricated.

§ 05Command center

Cost, budgets, and the morning digest.

Beyond the queue: a morning digest email lands with exactly what needs a human today. Every task carries an SLA time budget with an escalation ladder that moves work up before it breaches.

Per-case AI cost is visible on the dashboard — cost per case, top outliers, and budget alerts before you overspend — and Plan & usage shows what the workspace is consuming, so nothing is a surprise at renewal.

Morning digest
What needs a human today
SLA budgets
Escalation before breach
Per-case cost
Outliers + budget alerts
Plan & usage
What the workspace consumes
§ 06Approvals

Approve from your inbox or Teams.

A manager can advance a case by replying APPROVE from email or Microsoft Teams — no app to open, no password to remember. The reply is parsed, checked against the assignee's own identity and role, and only then does the process move. Every reply is on the record.

Email and Teams are live today; WhatsApp replies are configurable per workspace.

Email
Reply to advance — live
Microsoft Teams
Linked identity — live
WhatsApp
Configurable per workspace
Every reply
Identity-checked + audited
§ 07Process Lens

Process Lens — your process X-ray.

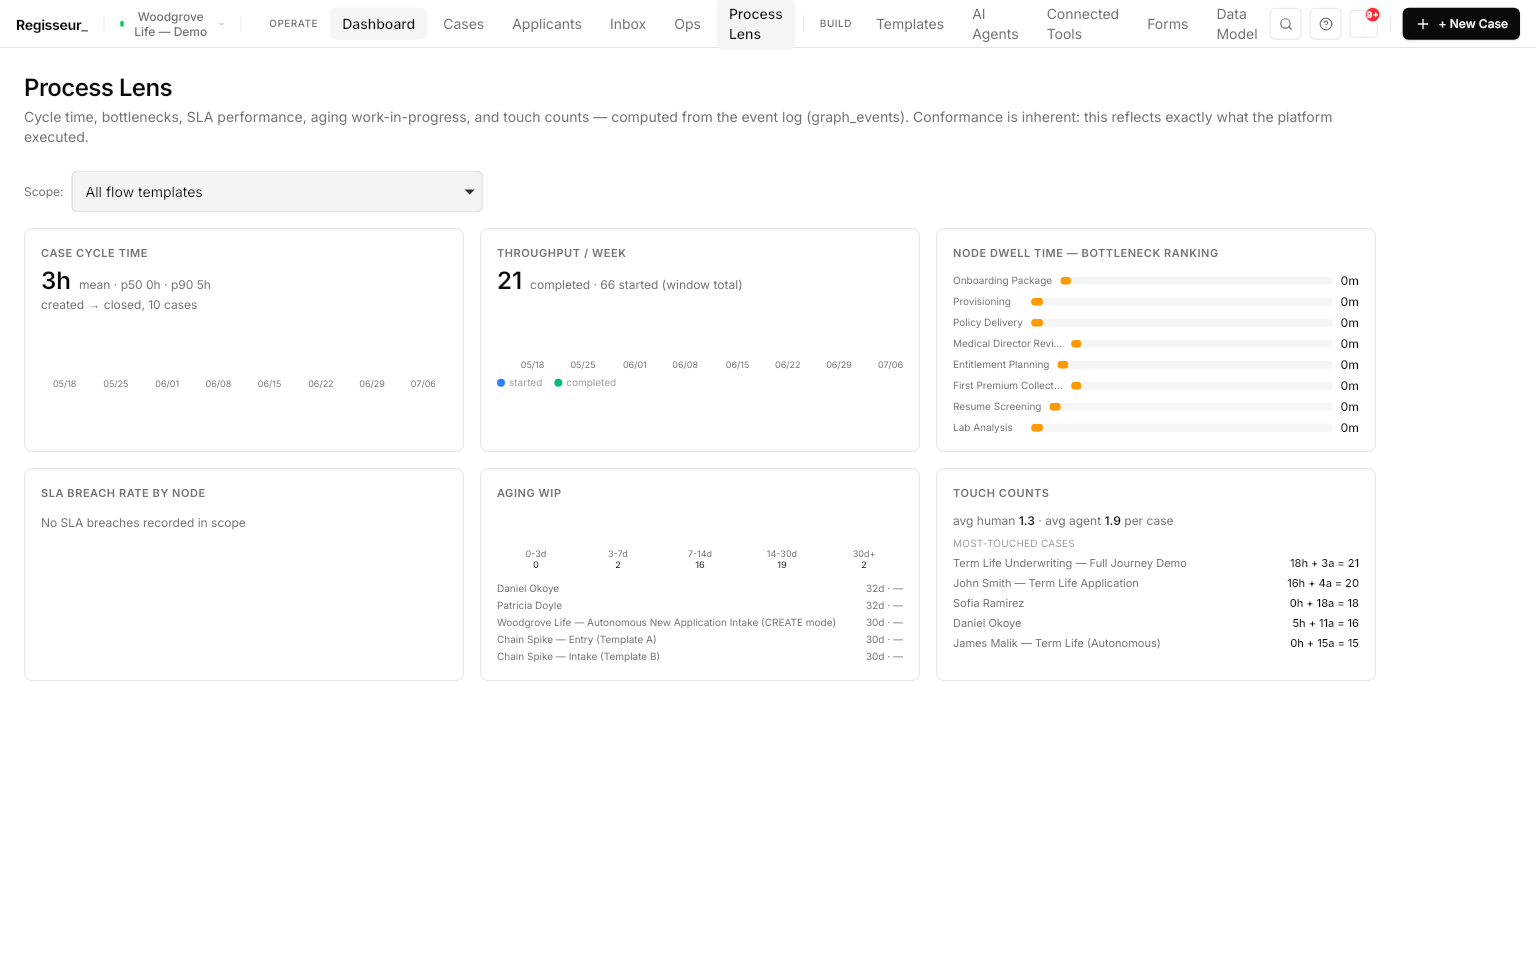
Per-process analytics, computed from the audit record: a funnel of how many cases enter each step, node-level dwell and bottleneck analysis, cycle time, and SLA-breach and aging-work views.

Because it's derived from the same record that runs the work, there's no separate tracking layer to feed and reconcile. The audit trail isn't just for compliance — it's your process X-ray.

Funnel
Entries + dwell per node
Bottlenecks
Where cases wait
Aging work
SLA breach + WIP
Source
The audit record itself
The Process Lens analytics page across all templates — case cycle time, weekly throughput, node dwell / bottleneck ranking, aging work-in-progress, and human-vs-agent touch counts, computed from the event log.
Process LensCycle time, bottlenecks, aging WIP, and touch counts — from the event log
§ Next step

See the queue, the review screen, and the case record on your process.

Bring one process and its review gates. We'll route tasks to the right people, decide on a real review screen with the evidence attached, and trace the case end to end in its history.

Book a walkthrough When something goes wrong